Excel: Pivot Tables: Tracking Time
Imagine you need to log time for different clients and projects and periodically report your time by client and project. There are of course many applications dedicated to time-tracking, but you can easily create your own flexible system using Pivot Tables.
At a minimum, what you need to record is a date, the time you spent, the client name, and the project. So, after you enter the data consistently, you might end up with source data that looks something like this:

Note that there are no blank lines - you just need to enter the data as you go.
Now the summaries. First, you might want an overview of your time by week. Here we are using the week numbers provided by Excel's WEEKNUM function (see column C of the source data):

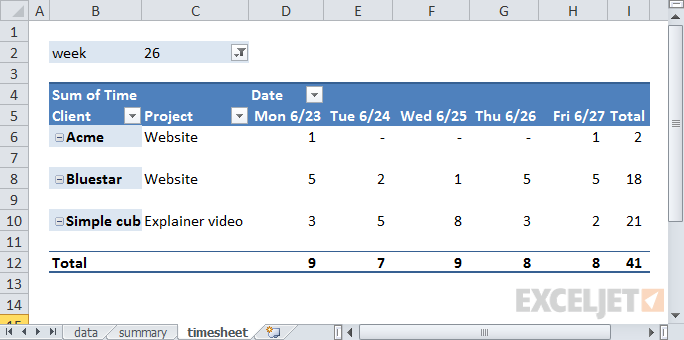
You might also want to arrange the pivot table to show a more traditional timesheet layout, with days of the week across the top:

Each time you filter on a different week number, your pivot table will build a new time sheet that displays the dates that belong to the week.
Note that by adding a column for Name to the data, you could track and report time for multiple people. You could also add a rate column to the data and use a pivot table to summarize the cost or billing rate of time logged.
- Printer-friendly version
- Log in to post comments
- 4820 reads

